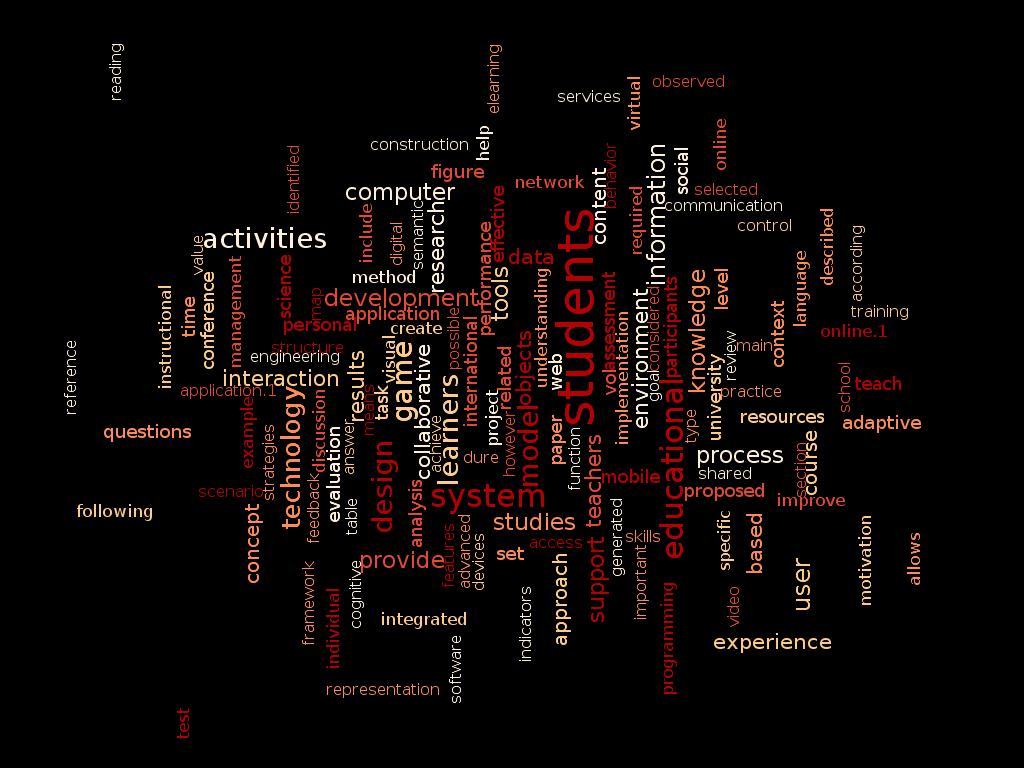
Word cloud for both sets combined and before considering difference in occurrence between the two sets of papers: word sizes indicate frequency.
This is an un-interpreted and automatically-generated report to show the variation in terms used in the full text of papers from two conferences: ICALT 2011 and ICALT 2012. A separate subsection shows those terms that appear more frequently in papers from each conference in turn. Selection criteria based on statistical significance are used to determine which terms are selected; the probability that the difference in frequency might be due to pure chance must be less than 0.1% in addition to other criteria to select dominant terms (see "technicalities").
All plots will open in a new window/tab as 1000x1000 pixel images if clicked on. The "Wordle" is 1024x768.
Only middle-frequency words are considered; the comparison is between terms that are neither very common nor very rare in the aggregate of all papers being analysed.
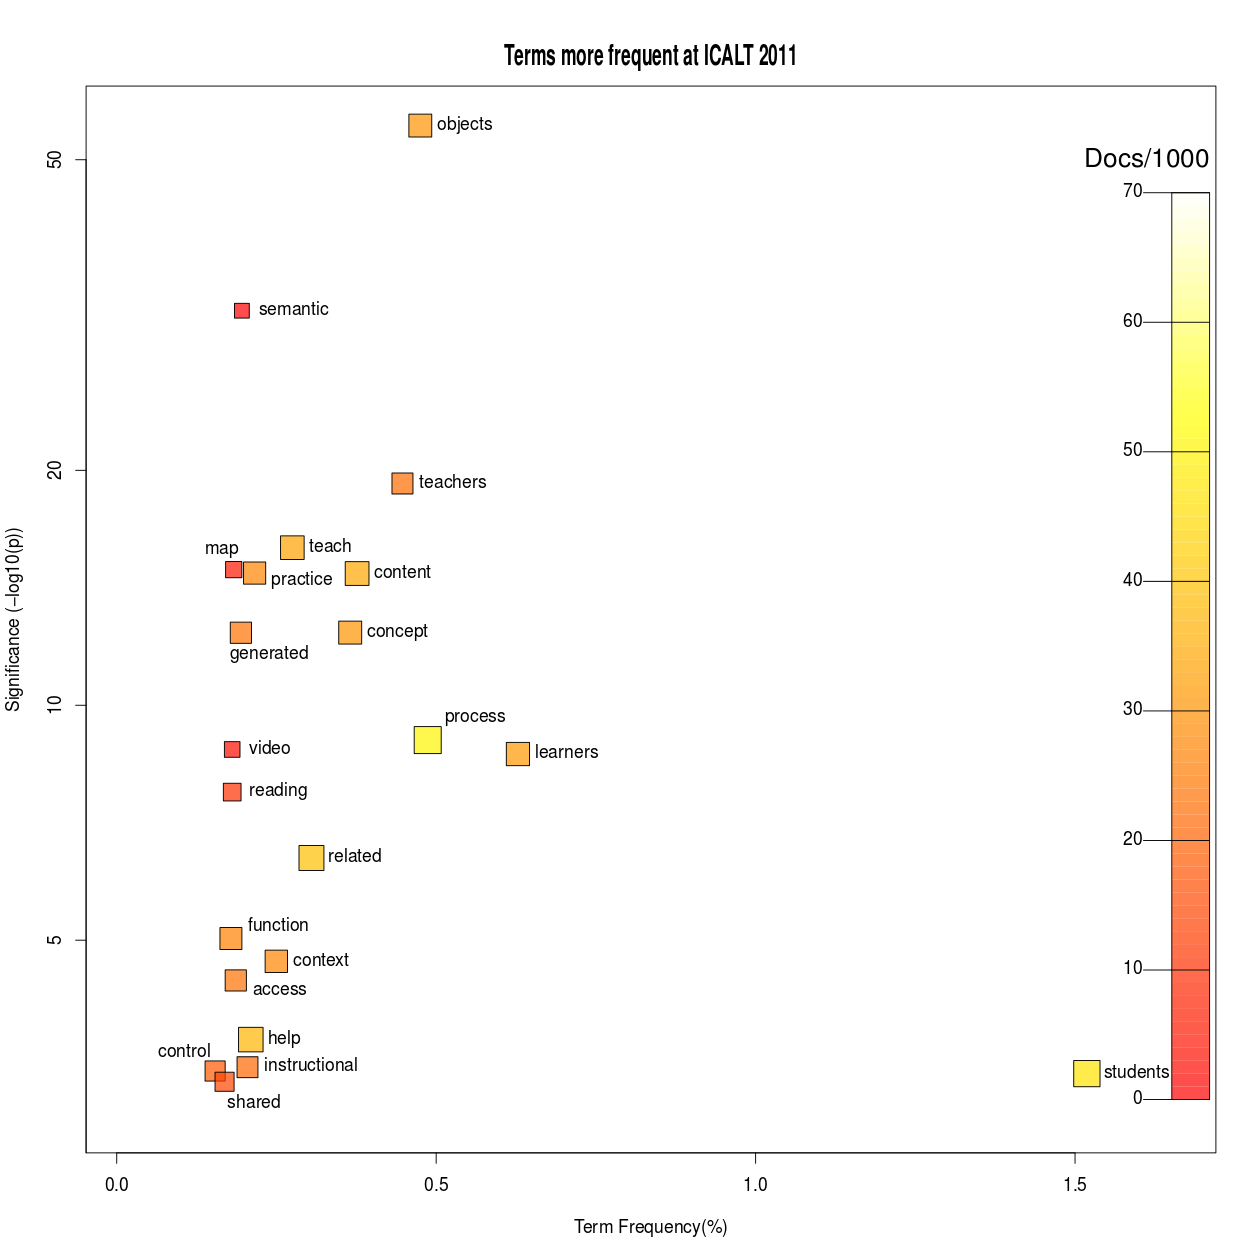
This plot shows those terms with a statistically-significant higher frequency in ICALT 2011 papers.
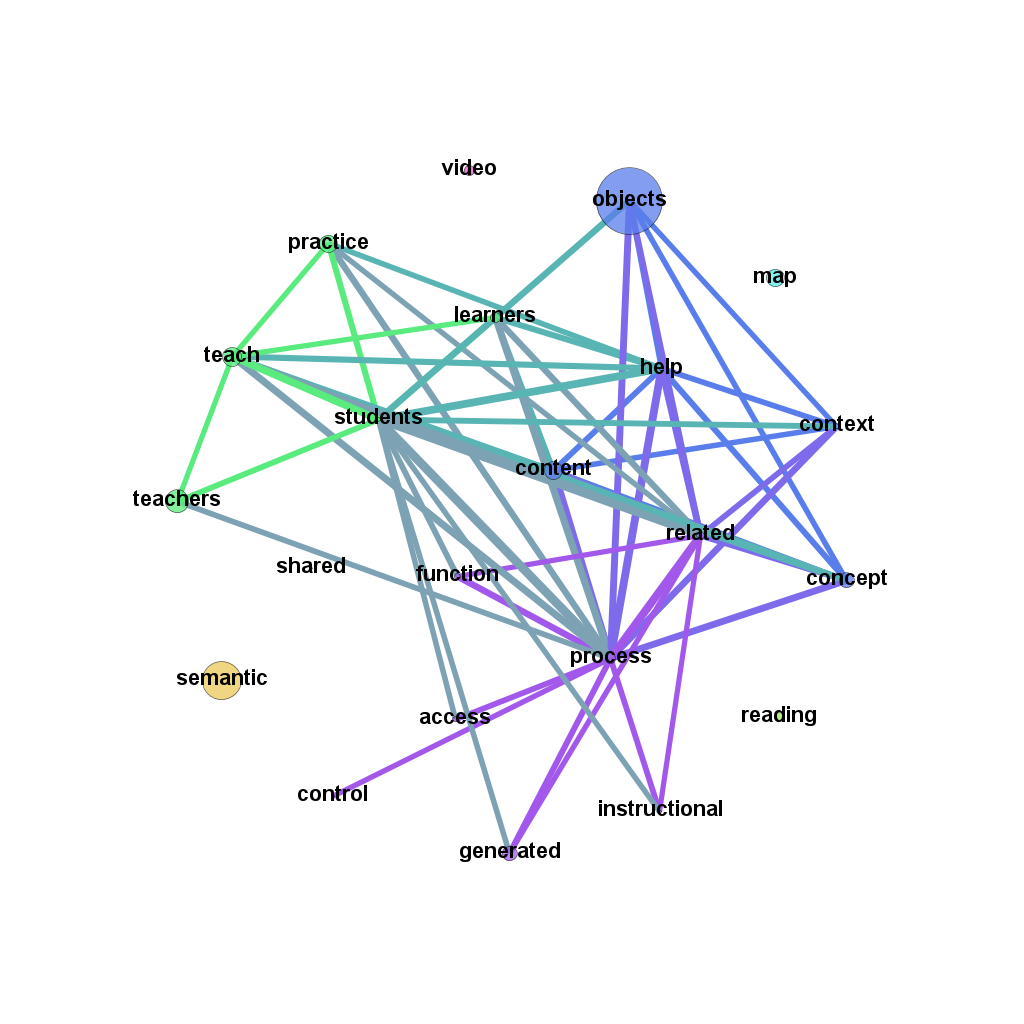
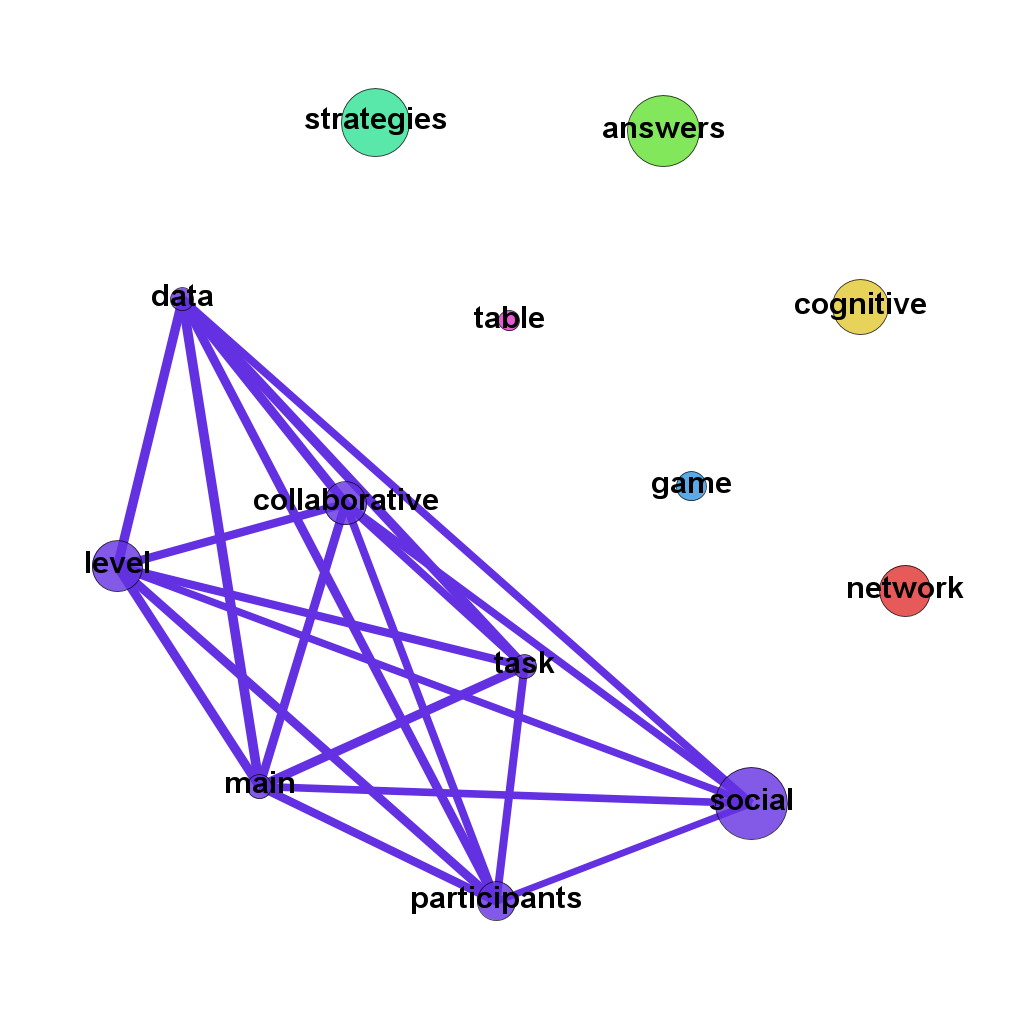
This plot shows the extent to which pairs of the higher frequency terms occur together in the same paper.
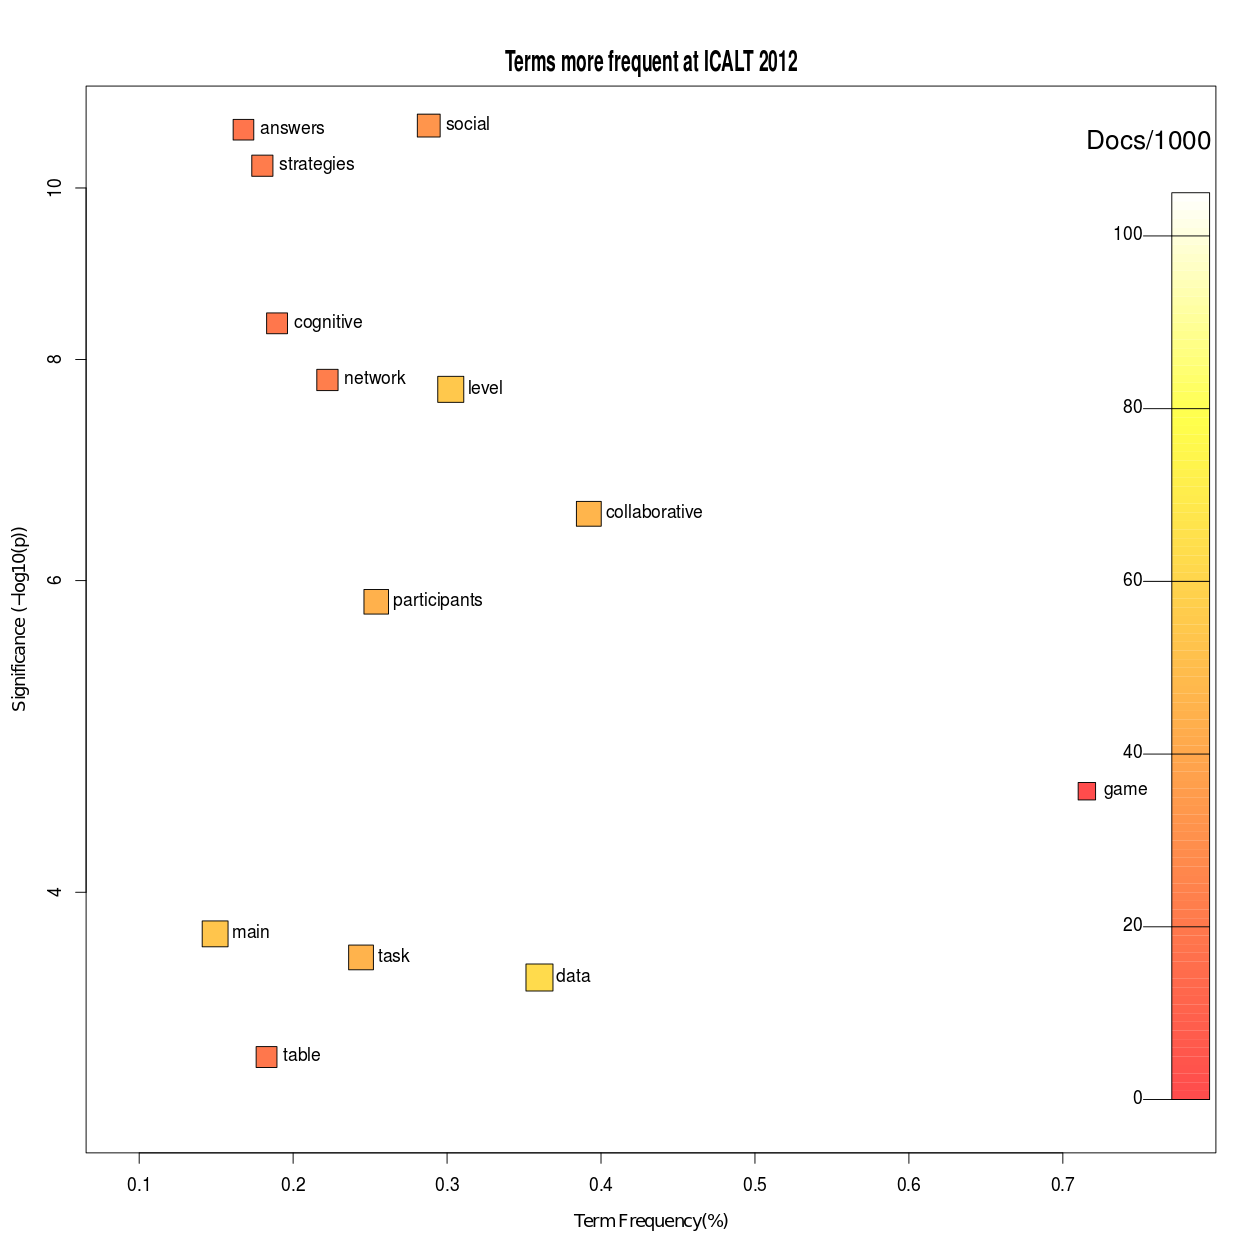
This plot shows those terms with a statistically-significant higher frequency in ICALT 2012 papers.
This plot shows the extent to which pairs of the higher frequency terms occur together in the same paper.
Source code for processing and formatting is available on GitHub.
Raw results are available in pairs, one of each kind being the data behind the two sections above. Gephi files are available separately for ICALT 2011 and ICALT 2012. All are under the same licence terms as this report.
The log file contains run parameters.
The technicalities of the method and explanatory notes on the content of the above downloads may be found on the GitHub wiki. These notes explain the term-selection criteria.
This work was undertaken as part of the TEL-Map Project; TEL-Map is a support and coordination action within EC IST FP7 Technology Enhanced Learning.![]()
 |
This work, its images and original text are ©2012 Adam Cooper, Institute for Educational Cybernetics, University of Bolton, UK. Adam Cooper has licenced it under a Creative Commons Attribution 3.0 Unported License |